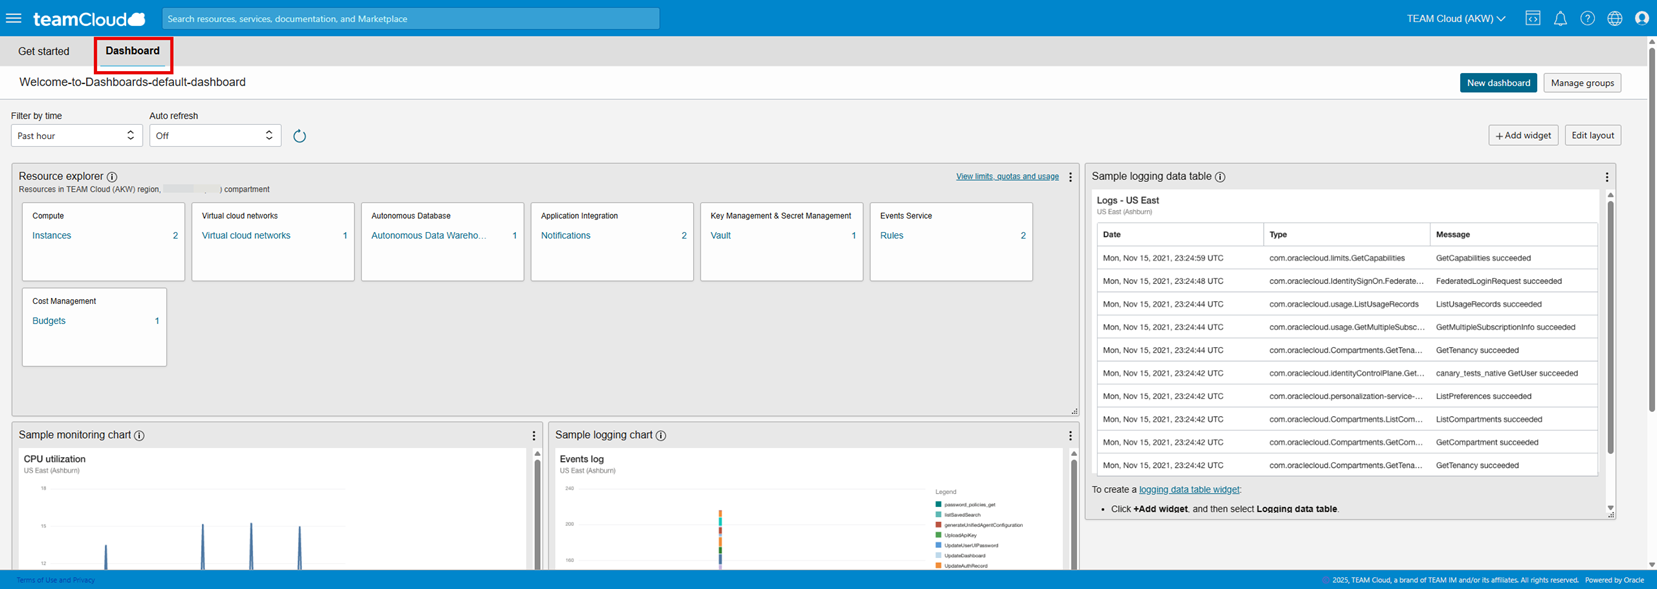
Logging into the TEAM Cloud Console
When you sign up to use TEAM Cloud infrastructure, you receive a customized URL for your organization. For example: https://cloud.sovereigncloud.nz/?tenant=CompanyABC%E2%80%8B
If you instead use the base URL https://cloud.sovereigncloud.nz you are prompted to specify your tenant (or cloud account) name on the sign-in page, along with your username and password.
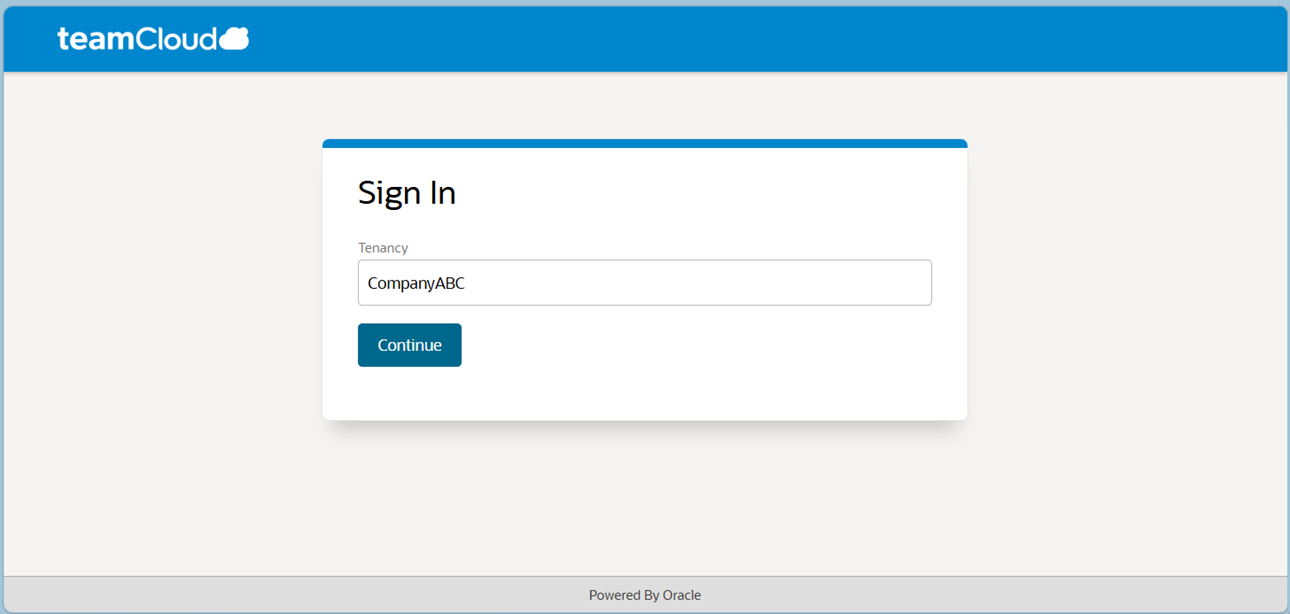
Review the TEAM Cloud Console
If you are familiar with the OCI Console, then you will find the TEAM Cloud Console has a similar look and feel, providing a single interface to manage all your TEAM Cloud services.
The Getting Started tab displays some of the following items:
To navigate through the services and features, click the hamburger menu in the left upper corner.
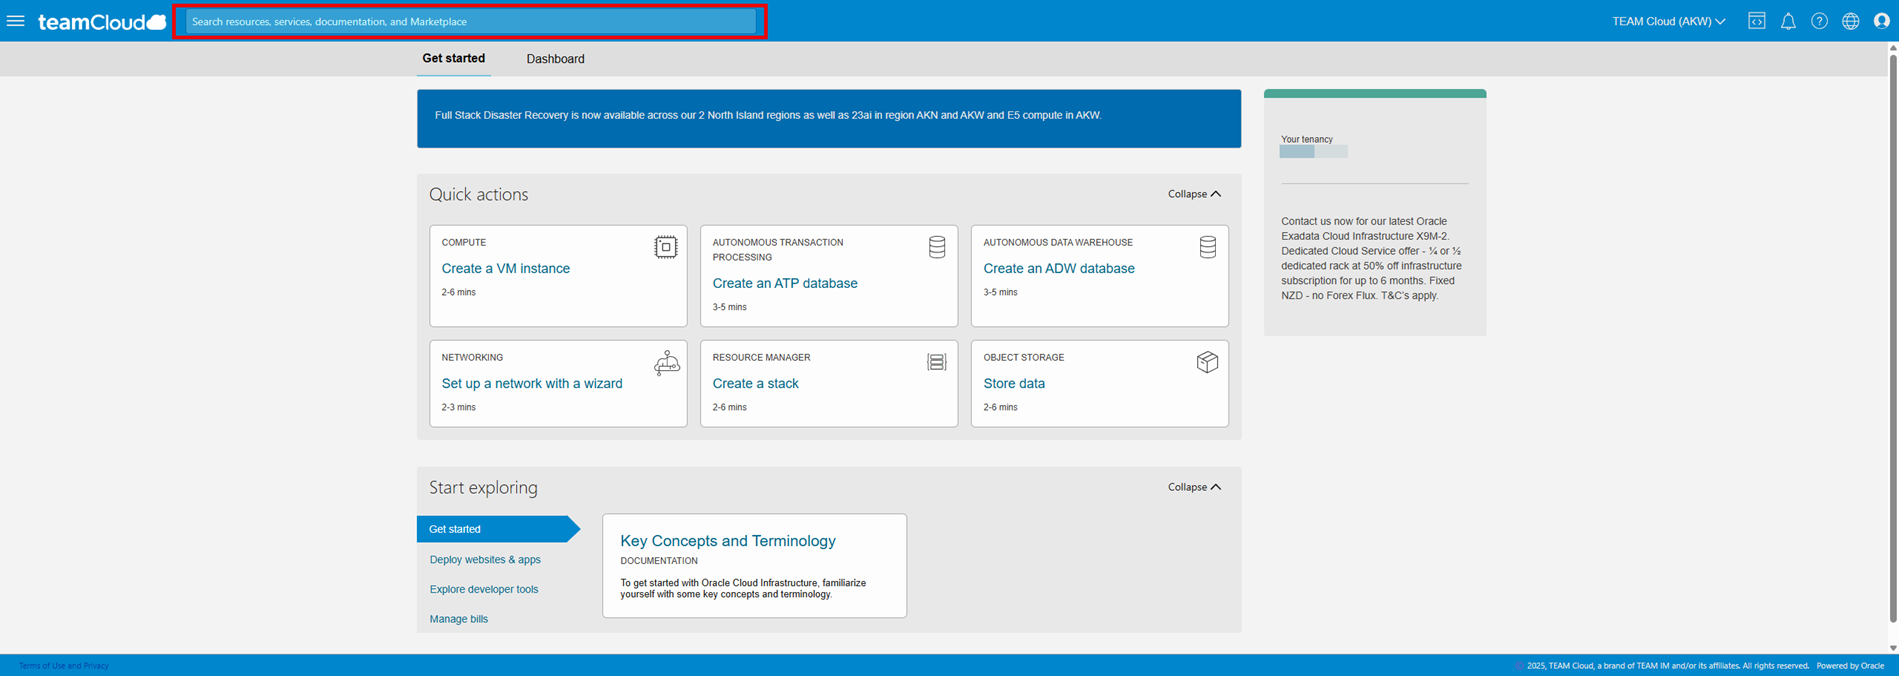
Quick actions - Access complete solutions that you can run quickly in the tenancy. Quick actions let you try different use cases and products without creating all the steps for deploying and configuring individual resources yourself.
You can view your home region in the mast head of the console and manage and subscribe to the peer region here. Your current region is displayed at the top of the Console. If your tenancy is subscribed to multiple regions, you can switch regions by selecting a different region from the Region menu. The Console provides a view of the resources in only the current region. If you don't see environments or other resources that you expect to see, verify that you're viewing the correct region.
Working across regions: When you're working within a service, the Console displays resources that are in the selected region. For example, if your tenancy has instances in a compartment in AKW, and instances in the same compartment in AKN, you can view the instances in only one region at a time, even though the instances are in the same compartment.
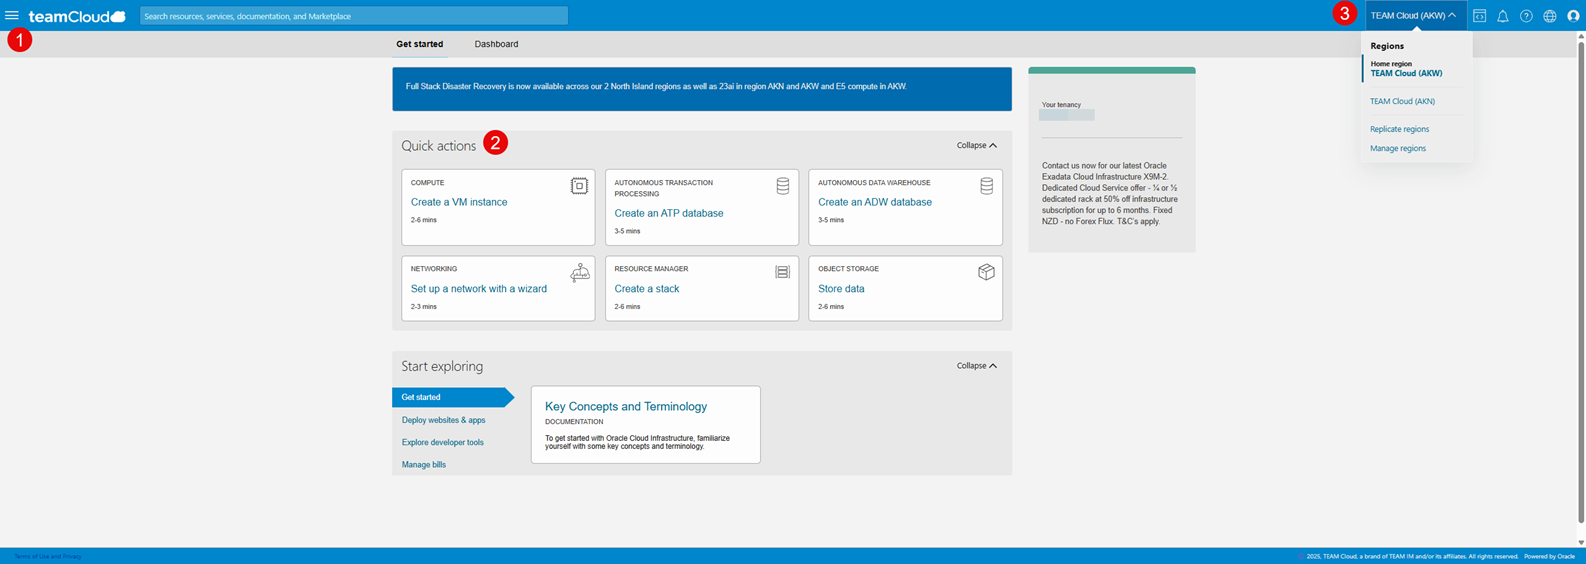
Navigating to Services
Open the navigation menu in the upper-left corner of the Console to work with services and resources.
Services and resources are organized by functional group. For example, to work with Compute service instances: Open the navigation menu and select Compute. Under Compute, select Instances.
For faster navigation, you can pin items to make them appear in the Pinned section of the Home page.
To pin an item, hover your cursor over the item and then click the pin to the left of the item name.
The Recently visited section under Home shows recently used navigation items. To quickly find navigation menu items, use the Search box at the top of the menu.
Finding resources
Console Search - Use Search to find resources in a tenancy, Console pages in services, and documentation in the https://docs.cloud.sovereigncloud.nz/en-us/iaas/Content/home.htm .
To use Search, start typing in the search bar in the header of the Console. You are immediately shown matching results in the region you are currently viewing. To see matching resources in another region, switch to that region.
Tenancy Explorer - The tenancy explorer provides a cross-region view of all your resources. You can choose to view just the resources that reside in the selected compartment, or you can choose to view all the resources in all the sub compartments as well, to get a full view of the compartment tree.
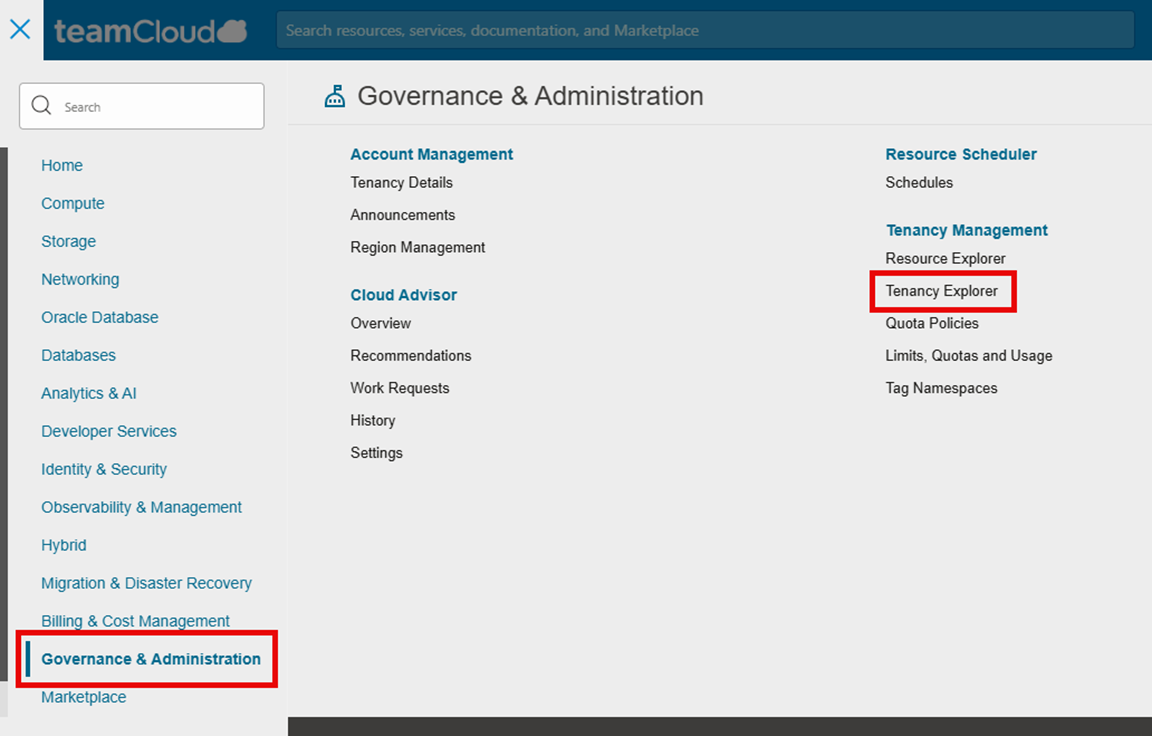
To navigate to the tenancy explorer, open the navigation menu and click Governance & Administration. Under Tenancy Management, click Tenancy Explorer.
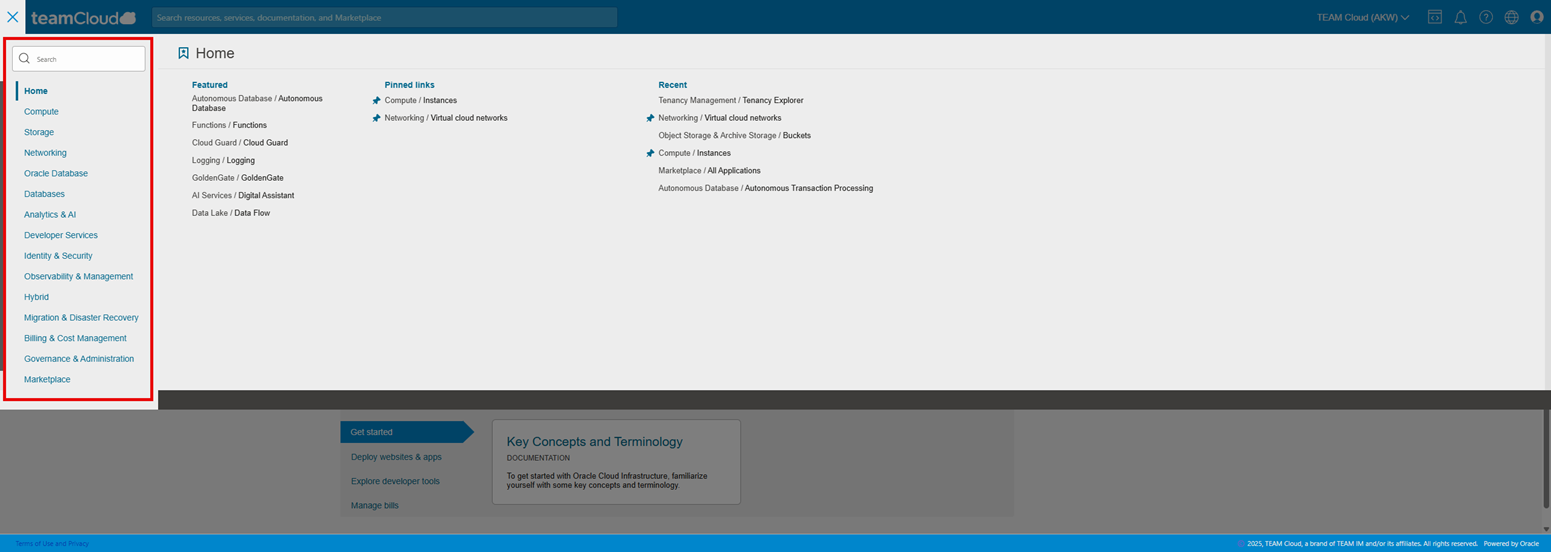
Dashboard Resource Explorer - The resource explorer displays the list of services and count of resources in a selected compartment and region.
To set up a dashboard with the resource explorer, access the console dashboard. Open the navigation menu and select Dashboards on the Home page. See next page for anoverview of the Console Dashboard Service.
Dashboard Service Overview
The Console Dashboards service allows you to create custom dashboards in the TEAM Cloud Console to monitor resources, diagnostics, and key metrics for your tenancy.
Dashboards gather data from TEAM Cloud services to create charts and tables that give you a quick view into your resource utilization, billing, and system health.
A dashboard is a collection of widgets. Each widget presents one set of data. For example, a widget could be a graph showing CPU metrics from the Monitoring service or abar chart displaying the prevalence of different types of errors. The collection of widgets in a dashboard gives you a centralized view of your infrastructure and system health.